STATIMRESEARCH
Quality of Earnings Report
CrowdStrike Holdings, Inc. (CRWD) · Nasdaq · fiscal year ends 31 January
Data through the quarter ended 30 April 2026, the most recent period in SEC XBRL company facts at the time of writing. This report asks one question: are the reported numbers real and repeatable?
The Verdict
| Grade | Conviction | In one sentence |
| WATCH | HIGH | Cash generation is exceptional and the accrual and deferred-revenue signals are genuinely strong — but the entire distance between a GAAP loss and $1.4B of reported free cash flow is stock-based compensation, which is a real economic cost settled in dilution rather than cash. |
Grades, printed in every issue: CLEAN — reported earnings are well supported by cash and no test shows material divergence. WATCH — one or more tests show a trend worth monitoring; no single finding is decisive. CONCERNING — several tests diverge, or one diverges materially. Conviction is High when every test was computed from primary filings, Moderate when some rest on estimates, Low when key inputs could not be obtained.
The earnings bridge
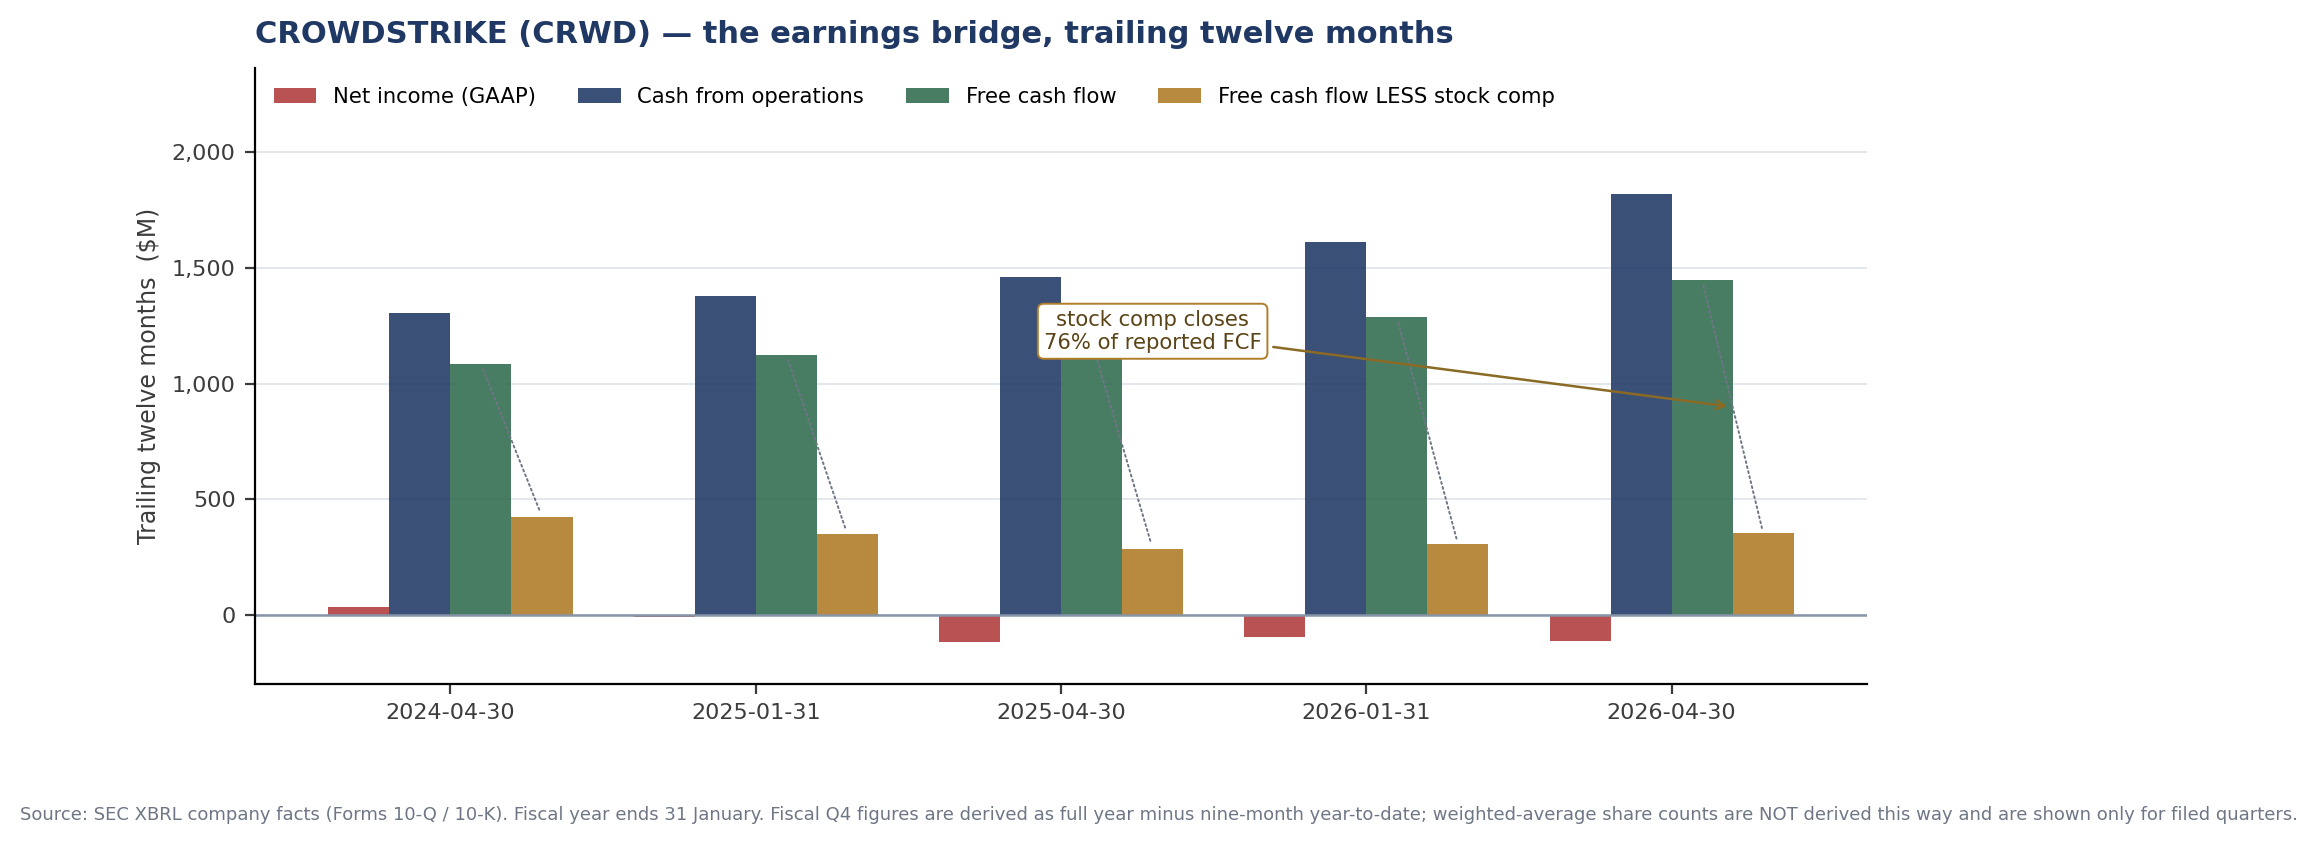
Read the gold bar. Over the trailing twelve months CrowdStrike reported a GAAP net loss of $111M, cash from operations of $1,819M, and free cash flow of $1,446M. Stock-based compensation over the same period was $1,094M — 76% of reported free cash flow, and 9.8 times the size of the net loss. Strip it out and free cash flow is $352M rather than $1,446M.
That is not an accounting irregularity and nothing here suggests one. It is the defining economic fact about this business, and it is invisible if you read either the GAAP loss or the cash flow number on its own.
The tests
| Test | Latest | Direction | Finding |
| Accruals ratio | −19.3% | Stable | Net income minus cash flow, over average assets. Strongly negative across every period, meaning cash comfortably exceeds reported earnings. On the conventional reading this is a high-quality signal — there is no evidence of earnings being pulled forward ahead of cash. |
| Cash conversion | not meaningful | — | Cash from operations divided by net income is undefined here because net income is negative. Printing a ratio would produce a misleading number, so we show none. Cash generation is instead measured against revenue: operating cash flow is 37.5% of trailing revenue. |
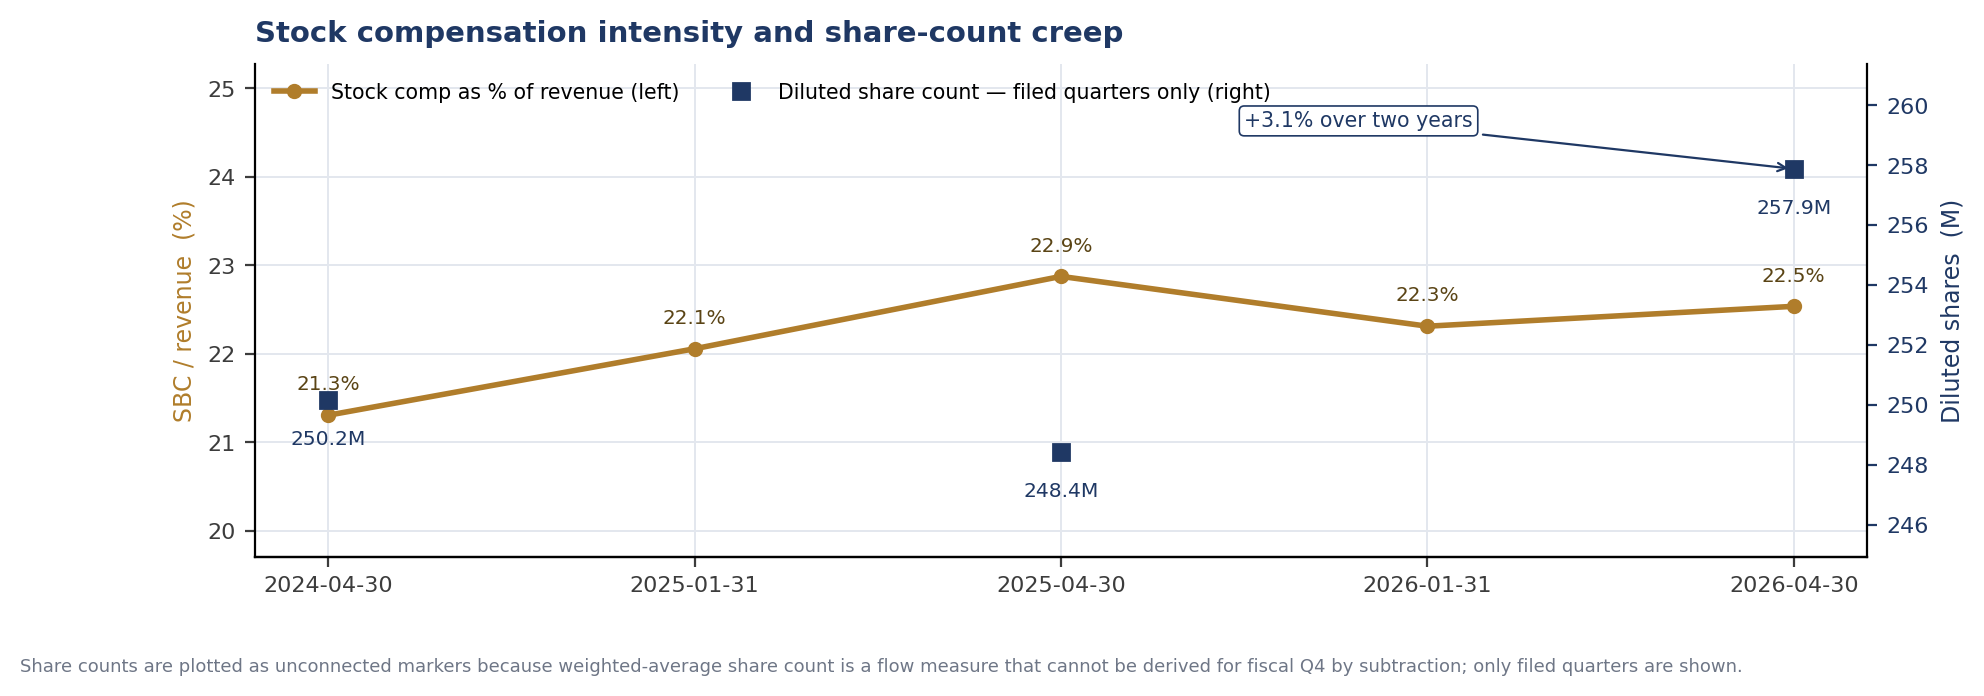
| Stock comp intensity | 22.5% of revenue | Rising | $1,094M trailing, up from $660M two years ago. The ratio has drifted from 21.3% to 22.5% while revenue itself grew 57%, so the absolute cost is growing considerably faster than the ratio suggests. |
| Share-count creep | +3.1% | Rising | Diluted shares 250.2M to 257.9M across the two comparable filed quarters. Real dilution, but modest against the scale of the compensation expense — much of it is offset. |
| Days sales outstanding | 70 days | Improving | Compared like-for-like against the same fiscal quarter: 83 → 75 → 70 days at each 30 April. Collections are getting faster, not slower. No sign of revenue being recognised ahead of cash. |
| Deferred revenue | $4,722M | Rising | Current plus non-current, up from $2,404M three years ago — growing faster than revenue. For a subscription business this is the strongest single quality marker available: customers are paying in advance of recognition. |
| Filing hygiene | Clean | — | No restatements, auditor changes, or late filings identified in the periods reviewed. |
Compensation intensity and dilution
What this means
The quality picture splits cleanly in two, and both halves are true at once.
| Finding | |
| Genuinely strong | Deferred revenue is growing faster than revenue, days sales outstanding is falling on a like-for-like basis, and the accruals ratio is deeply negative. Each of those points the same way: the cash is arriving before the revenue is recognised, not after. Businesses that are stretching to make numbers do not usually look like this. |
| The offsetting fact | None of that changes what stock compensation costs. $1,094M a year is a real transfer of ownership to employees, and the fact that it never appears as a cash outflow is precisely why it flatters every cash-based measure. Free cash flow of $1,446M and free cash flow of $352M are both defensible figures for the same company; they answer different questions. |
Why the grade is Watch rather than Concerning. Nothing here suggests the numbers are wrong. The tests that detect earnings being manufactured — accruals, receivables, deferred revenue — all point the other way. The finding is about interpretation, not integrity: reported cash generation overstates economic earnings by an amount close to stock compensation, and that gap has grown in absolute terms every period we examined. Why the grade is not Clean. A gap equal to 76% of reported free cash flow is too large to pass without comment, and it is widening. |
What would change the grade
| Trigger | Effect |
| Stock comp falling below ~15% of revenue with share count flat | Moves toward Clean. The gap between reported and economic cash generation narrows to something that no longer dominates the analysis. |
| Deferred revenue growth falling behind revenue growth | Moves toward Concerning. It would mean recognised revenue is outrunning cash collected — the reverse of today's position, and the single most important series to watch here. |
| Days sales outstanding rising on a like-for-like quarter | Moves toward Concerning. Would suggest sales are being booked faster than they are collected. |
| Accruals ratio turning positive | Moves toward Concerning. Would mean reported earnings had begun to exceed cash generation. |
Verification status
18 data points: 16 Verified · 0 Estimate · 2 Unverified. Verification Score 89%.
| Data point | Status | Source |
| Revenue, net income, cash from operations, capex | Verified | SEC XBRL company facts, Forms 10-Q and 10-K |
| Stock-based compensation | Verified | SEC XBRL company facts |
| Accounts receivable; deferred revenue, current and non-current | Verified | SEC XBRL company facts, balance-sheet instants |
| Weighted-average diluted shares | Verified | SEC XBRL company facts, filed quarters only |
| Fiscal Q4 figures | Verified (derived) | Computed as full year minus nine-month year-to-date from filed figures. Arithmetic on primary data, not an estimate. |
| No restatement or auditor change | Unverified | Absence of evidence in the filing index reviewed; a full audit-opinion read was not performed |
| Peer or sector comparison | Unverified | Out of scope for this report — every finding is measured against the company's own history |
Caveats
CrowdStrike's fiscal year ends 31 January, so the quarters here do not align with calendar quarters and the comparisons are drawn against the same fiscal quarter a year earlier. Weighted-average share count is a flow measure and cannot be derived for fiscal Q4 by subtraction; it is plotted only for filed quarters and shown as unconnected markers for that reason. Cash conversion is rendered "not meaningful" rather than as a ratio, because a negative denominator produces a number that reads as favourable and is not. This report asks whether reported results are supported by cash and by the balance sheet; it is not a valuation and takes no view on the share price.
Statim Research reports are independent research for informational and educational purposes only — they are not investment advice, not a recommendation to buy or sell any security, not tailored to any individual's circumstances, and Statim Research is not a registered investment adviser.