STATIMRESEARCH
Lucid Group, Inc. (LCID)
Snapshot Report · Nasdaq · 10 August 2026
LAST PRICE $6.63 | CHANGE −$0.41 (−5.75%) | PRIOR CLOSE $7.04 | MARKET CAP ~$2.77B | 52-WEEK RANGE $2.37 – $25.23 | SHARES OUT 394,070,176 |
As of 10 Aug 2026, 13:23 CT — delayed feed, session in progress. Prior close, range and OHLC are completed-session data. Shares outstanding as of 29 Jul 2026 per the Q2 10-Q. Market cap is a provider estimate.
Headline Metrics
| Metric | Reading | Basis — and what the scale means |
| Verification Score | 73% | 16 of 22 data points in this report confirmed against a primary source; 3 derived (Estimate); 3 unconfirmed. Scale is the share Verified. See page 3. |
| Volatility Band | Extreme | 20-day realised volatility 159% annualised; 14-day ATR is 11.4% of price. Bands: under 25% Low · 25–50% Moderate · 50–80% High · 80–120% Very High · above 120% Extreme. |
| Catalyst Density | 4 back / 0 forward | Four material 8-K events in the trailing 60 days. Zero company-confirmed dated events ahead — Q3 results have not been scheduled. |
| Insider Net Direction | Net acquisition | All Form 4 activity since May is equity grants and tax withholding. Only open-market sales are 2,000 shares total by one director under a pre-arranged plan. |
| Level Proximity | −6.8% / +10.0% | Distance from last price to the nearest identified support ($6.18) and resistance ($7.29). Levels are derived — Estimate. |
Executive Summary
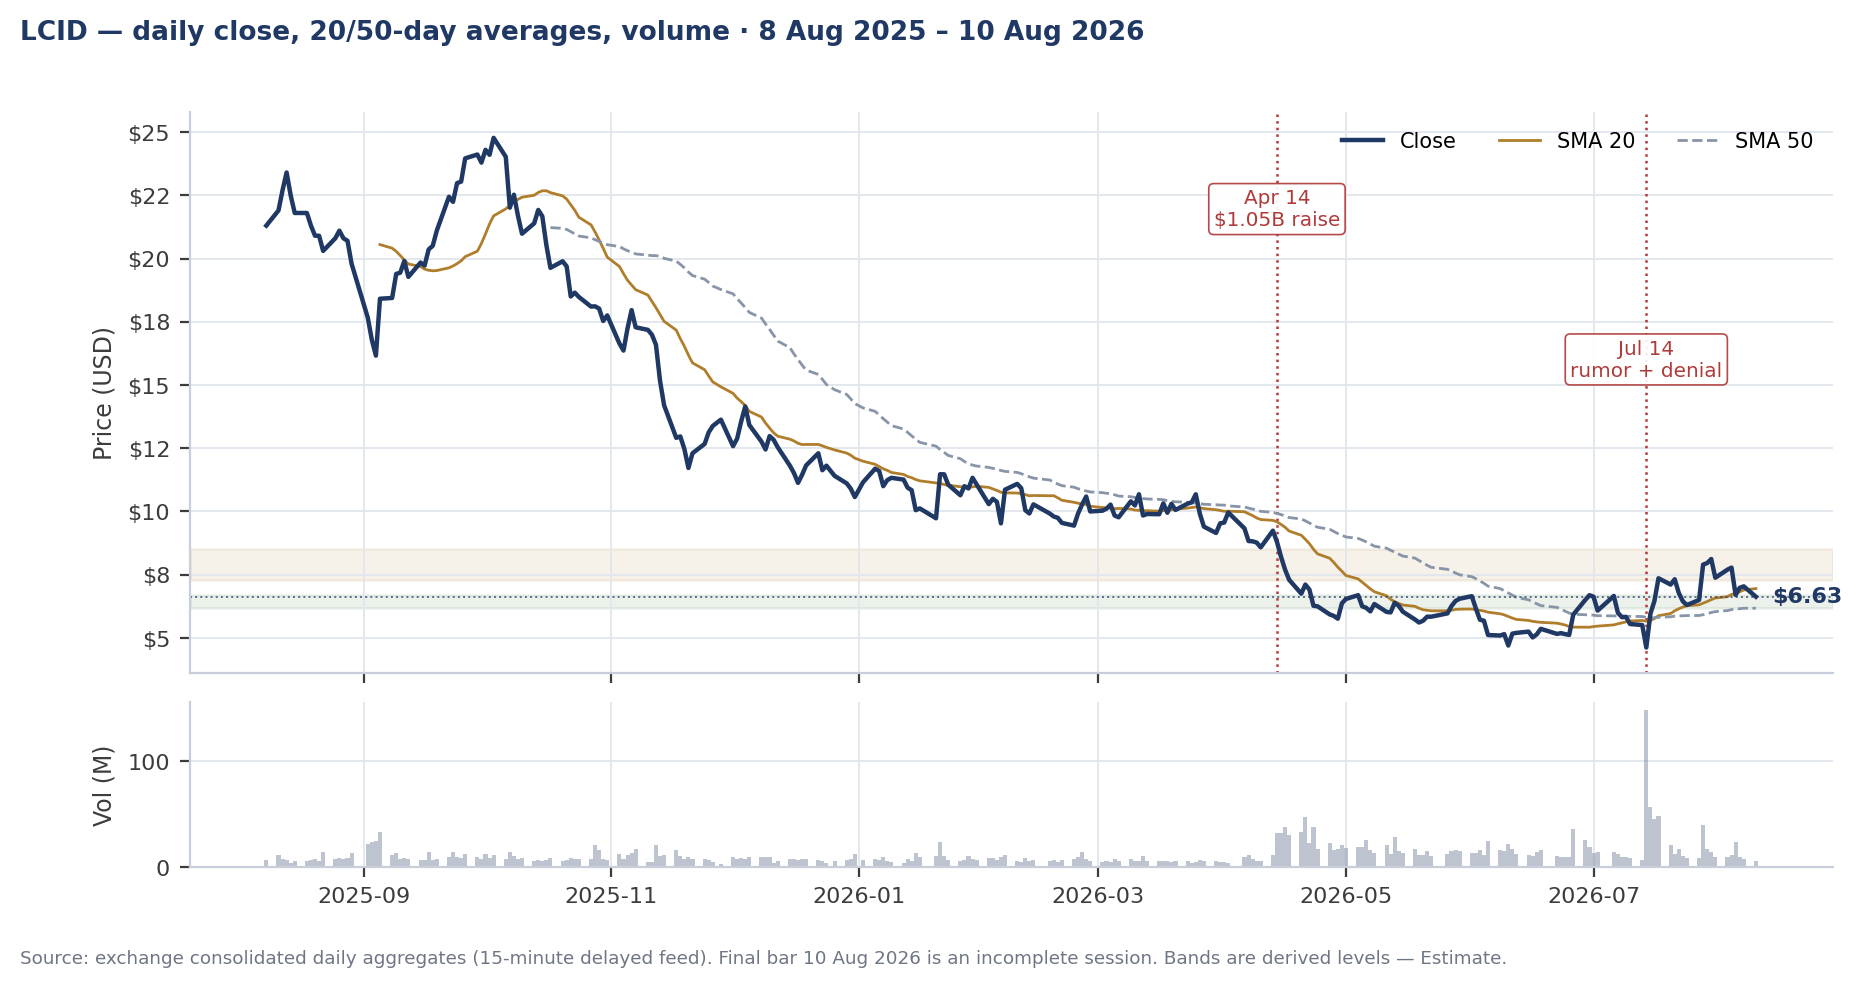
Lucid has fallen roughly 74% over the past twelve months, from a $25.23 high to $6.63, and the decline has been driven by capital structure rather than by any single operational miss. The pivotal date is 14 April 2026, when the company filed an unlimited automatic shelf and simultaneously priced a ~$1.05 billion raise — 36,057,692 common shares at $8.112 alongside $550M of Series C convertible preferred to a Saudi PIF affiliate and a $200M Uber investment. Price has not traded back above that $8.112 issue price since.
The second defining event was 14 July 2026, when an unsourced blog report claiming the board was weighing a take-private or Chapter 11 sent the stock to $2.37 intraday on 149 million shares — roughly sixteen times normal volume — before the company filed an 8-K the same day stating the rumors were "completely false" and that it has "sufficient liquidity to carry its operations well into next year." Shares closed that session at $4.62 and have since recovered to the current $6.63. Q2 results on 4 August showed revenue up 56% year over year to $405.3M against a ~$1.035B net loss, with production deliberately cut 13% sequentially and guidance still suspended. The stock now sits 31% below its 200-day average but 7% above its 50-day, with momentum neutral — a market that has stopped falling without deciding anything.
Evidence
Trend & Moving Averages
| Average | Value | Price vs. | Read |
| 20-day | $6.90 | −3.8% | Price slipped back below the short-term average today after four sessions above it. |
| 50-day | $6.17 | +7.5% | Holding above the 50-day is the single constructive feature of the current tape. |
| 100-day | $6.91 | −4.0% | Clustered with the 20-day. The $6.90–$6.91 shelf is the immediate decision point. |
| 200-day | $9.64 | −31.2% | Deeply below. The long-term trend is unambiguously down and has been all year. |
Averages computed from completed sessions through 7 Aug 2026. Derived values — Estimate.
Support & Resistance
| Level | Role | Basis | Status |
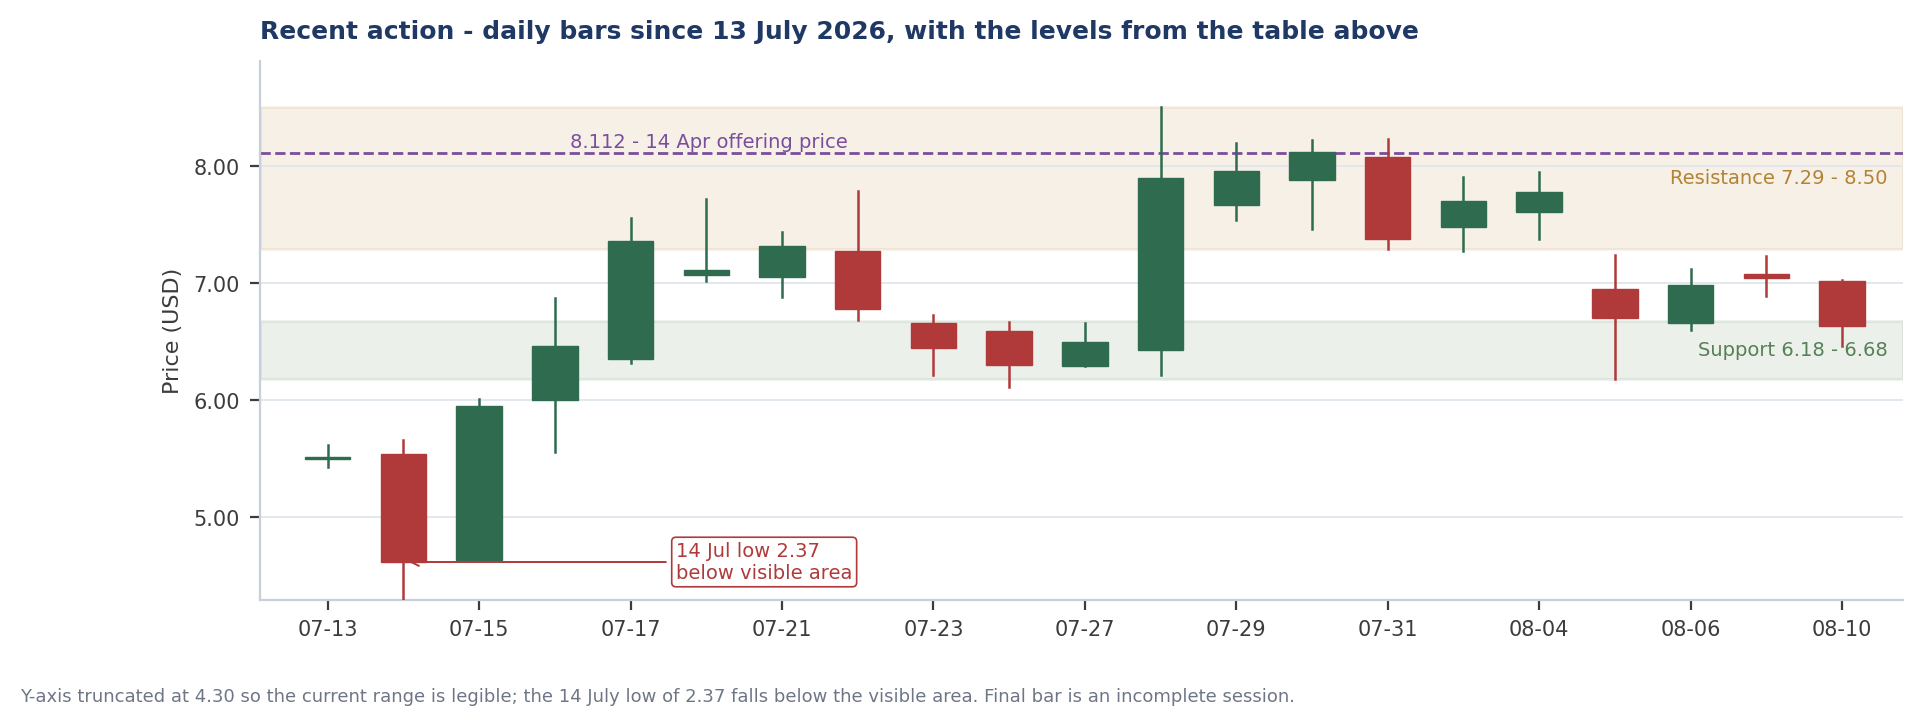
| $8.50 | Resistance | 28 Jul 2026 intraday high — the post-rumor recovery peak | Estimate |
| $8.11 | Resistance | 14 Apr 2026 offering price. Untouched since; buyers from that deal are underwater | Verified (424B5) |
| $7.93 | Resistance | Weekly floor-trader pivot R1 from the prior completed week | Estimate |
| $7.29 | Resistance | 31 Jul – 3 Aug consolidation low, now overhead | Estimate |
| $7.06 | Pivot | Weekly floor-trader pivot from prior week's high/low/close | Estimate |
| $6.18 | Support | 5 Aug 2026 session low; also the weekly S1 pivot at $6.17 — confluence | Estimate |
| $5.55 | Support | 13 Jul 2026 close, the last print before the rumor gap | Estimate |
| $2.37 | Support | 14 Jul 2026 panic low. Structurally significant, far below | Verified (feed) |
Momentum
| Measure | Value | Read |
| RSI (14) | 52.3 | Neutral. No overbought or oversold condition — momentum is not giving a signal in either direction. |
| ATR (14) | $0.80 | 11.4% of price. Daily range is extreme; any position sizing built on a normal-volatility assumption will be wrong. |
| Realised vol, 20d | 159% | Annualised. Elevated even against this name's own 60-day figure of 117%. |
| Volume, 10d avg | 14.9M | Against a 30-day average of 22.9M — participation is falling as price stabilises. |
Pattern Read
No named chart pattern qualifies at present. Price is consolidating in a $6.18–$8.50 range built entirely since the 14 July event, which is too young and too wide to constitute a recognised formation. The honest read is a post-shock base of undetermined outcome. A daily close above $7.29 on above-average volume would be the first evidence of resolution upward; a close below $6.18 would resolve it downward.
Context & Verification
Event Calendar
| Date | Type | Event | Status |
| 4 Aug 2026 | Reported | Q2 results: revenue $405.3M (+56% YoY), net loss ~$1.035B, cash $732.6M, total liquidity ~$3.0B. Production 4,774 (−13% QoQ), deliveries 3,953 (+28% QoQ). Guidance remains suspended. | Confirmed |
| 14 Jul 2026 | Reported | 8-K refuting take-private and bankruptcy rumors. Stock traded to $2.37 intraday on 149M shares. | Confirmed |
| 6 Jul 2026 | Reported | $800M drawn on the delayed-draw term loan from a PIF affiliate. | Confirmed |
| 22 Jun 2026 | Reported | 18% US workforce reduction; COO role eliminated. ~$158M annualised savings. | Confirmed |
| 14 Apr 2026 | Reported | ~$1.05B raise plus an unlimited automatic shelf registration. | Confirmed |
| Q3 2026 | Forward | Third-quarter results. No date announced by the company. | Not scheduled |
Insider Activity — Routine
Every Form 4 filed since May 2026 was pulled and read directly. The picture is routine: annual director equity grants of 43,870 shares each on 4 June following the annual meeting, and share withholding to cover taxes on vesting at $5.68–$5.72 on 4–5 June. The only open-market sales in the window are two 1,000-share disposals by director Ori Winitzer — 1 June at $6.38 and 3 August at $7.46 — both flagged as made under a pre-arranged trading plan, together worth under $14,000. There is no cluster of insider selling into the recovery.
The more informative signal in these filings is personnel, not trading: a Form 4 dated 5 August records an equity grant to Alexander De Bock as Chief Financial Officer, while filings from 5 June identify Taoufiq Boussaid in that role — a CFO change inside two months, alongside the elimination of the COO position in June. Form 4 filings never state motive; the classification above is an inference from transaction codes, timing and breadth.
Where This Read Stops Working
| Trigger | What it would mean |
| Daily close below $6.18 | The post-event base has failed. The next reference is $5.55, then a large gap toward the July low. |
| Daily close above $7.29 on above-average volume | The range resolves upward and $8.11 — the April issue price — becomes the objective. |
| Any new shelf takedown | The automatic shelf filed 14 April is unlimited and effective. A takedown can be priced without warning and would reset supply. |
| Reinstated guidance | Management withdrew guidance in May and did not restore it in August. Reinstatement in either direction changes the information regime entirely. |
Verification Status — condensed
| Data point | Status | Source |
| Price, OHLC, volume, 52-week range | Verified | Exchange consolidated daily aggregates, 15-min delayed |
| Shares outstanding 394,070,176 | Verified | Q2 2026 Form 10-Q, as of 29 Jul 2026 |
| Q2 revenue, net loss, cash, liquidity, units | Verified | Q2 2026 results release and Form 10-Q, 4 Aug 2026 |
| 14 Apr offering: 36,057,692 sh at $8.112 | Verified | Form 424B5 and company release, 14 Apr 2026 |
| 14 Jul rumor denial and quoted language | Verified | Form 8-K, 14 Jul 2026, Items 7.01 and 9.01 |
| All insider transactions May–Aug 2026 | Verified | SEC Forms 4, retrieved and parsed individually |
| Market capitalisation ~$2.77B | Estimate | Data provider; not reconciled to the 10-Q |
| Moving averages, RSI, ATR, realised volatility | Estimate | Derived from the daily close series |
| Support, resistance and pivot levels | Estimate | Derived from price structure and prior-period OHLC |
| Analyst consensus price target ~$8.30 | Unverified | Secondary aggregator; not confirmed against a primary source |
| Whether an at-the-market program is active | Unverified | Could not be confirmed from the filings reviewed |
| Q3 2026 earnings date | Unverified | Not announced by the company as of this report |
Caveats
The final price bar is an incomplete session and will change before the close. Lucid's reported Q2 net loss appears as ~$1.035B in the company's release; at least one filing summary reported $1,259.3M, a difference that may reflect loss attributable to common stockholders after preferred effects — the figure above is the company's own. A 1-for-10 reverse stock split took effect 29 August 2025, so all prices before 2 September 2025 shown here are split-adjusted. Levels and indicators marked Estimate are derived from price data and are analytical conventions, not predictions; they can and do fail.
Statim Research reports are independent research for informational and educational purposes only — they are not investment advice, not a recommendation to buy or sell any security, and Statim Research is not a registered investment adviser.