STATIMRESEARCH
Micron Technology, Inc. (Nasdaq: MU)
Price: $1,011.75 (8/17 close); premarket indication approximately $962 (-4.9%) | As of: 2026-08-18, 8:23 a.m. CT (premarket, delayed feed); analysis through the 2026-08-17 close
Full Equity Research Report — prepared 2026-08-18
Executive Summary
Micron Technology is the largest U.S. maker of memory chips — DRAM and NAND (the two basic types of computer memory and storage), and high-bandwidth memory, or HBM (the specialized stacked memory that AI processors require). Over the past year it has been the defining AI-memory stock: from roughly $113 last August to an all-time high of $1,255.00 on June 25, 2026, a rise powered by fundamentals rather than story — quarterly revenue more than quadrupled year over year ($9.3 billion to $41.5 billion) and gross margin (the share of each sales dollar left after production costs) rose from 37.7% to 84.6% as AI data-center demand outran the industry's ability to supply memory.
The stock then corrected 41% in five weeks, from the June 25 high to a low of $737.88 on July 29, as investors began pricing the other side of the cycle: announced capacity expansions across the industry, a Chinese memory maker's stock-market debut on July 27, and cautious research notes about 2027 memory pricing. Since that low the stock has recovered about 37% in thirteen sessions, reclaiming $1,000 on August 17 and touching $1,036 before fading. As this report is prepared, the stock is trading near $962 in the premarket — down about 4.9% and sitting directly on the first structural support: the $950-$961 band, which combines the average price paid by every buyer since the June top (approximately $950) with the 50-day moving average (approximately $961). Press coverage ties the morning weakness to patent-infringement actions Netlist filed against Micron at the International Trade Commission and in federal court (announced August 12), alongside broader memory-sector profit-taking.
The decisive levels are clearly drawn. Holding $950-$961 keeps the recovery structure intact; a daily close above $1,036 (the August 17 high, which coincides with the monthly pivot resistance at about $1,034) would open the $1,072-$1,110 zone. Losing $886 would put the early-August base at $827-$854 back in play, and a close below $827 would invalidate the recovery read entirely. The next scheduled catalyst is the fiscal fourth-quarter report, estimated for on or about September 22 (not yet company-confirmed), where management has guided to roughly $50 billion of revenue and about $31 of earnings per share for the single quarter.
Verification Status
Every data point below is tagged Verified (confirmed against a named source), Estimate (derived/approximate), or Unverified (flagged, not confirmed).
| Data point | Value | Status | Source |
|---|---|---|---|
| Last closing price | $1,011.75 (2026-08-17) | Verified | Exchange-sourced daily price data (delayed feed) |
| Premarket indication, 2026-08-18 | ≈$962 (-4.9%) as of 8:23 a.m. CT | Estimate | Exchange-sourced delayed feed; premarket prints are indicative only |
| Shares outstanding | 1,129,393,151 (as of 6/17/26) | Verified | SEC EDGAR Form 10-Q cover, acc. 0000723125-26-000015, filed 2026-06-25 |
| Market capitalization | ≈$1.10 trillion (at the 8/17 close) | Estimate | Price × shares outstanding |
| 52-week range | $113.46 (8/20/25) – $1,255.00 (6/25/26) | Verified | Exchange-sourced daily price data |
| FQ3-26 revenue (quarter ended 5/28/26) | $41.456B (vs $9.301B a year earlier) | Verified | SEC EDGAR Form 8-K Ex-99.1 press release, 6/24/26, acc. 0000723125-26-000013 |
| FQ3-26 earnings per share | $24.67 GAAP / $25.11 non-GAAP (diluted) | Verified | Same 8-K press release |
| FQ3-26 gross margin | 84.6% GAAP / 84.9% non-GAAP | Verified | Same 8-K press release |
| FQ4-26 company guidance | Revenue $50.0B ± $1.0B; non-GAAP EPS $31.00 ± $1.00; gross margin ≈86% | Verified | Same 8-K press release (guidance as issued 6/24/26) |
| Cash and equivalents | $24.995B (5/28/26); $30.2B including marketable investments | Verified | Form 10-Q acc. 0000723125-26-000015; 8-K press release 6/24/26 |
| Stockholders' equity | $100.724B (5/28/26), up from $54.165B (8/28/25) | Verified | Form 10-Q acc. 0000723125-26-000015; Form 10-K filed 2025-10-03 |
| Long-term debt | $8.844B (as of 11/27/25); reduced further by cash tender offers for 2031-2035 notes announced 3/25/26 | Verified | Form 10-Q filed 2025-12-18; Form 8-K Item 8.01, 3/25/26 |
| Share repurchases | $650M (2.5M shares) in FY26 first nine months; $7.84B cumulative under the May 2018 authorization; none in FQ3 | Verified | Form 10-Q acc. 0000723125-26-000015 |
| Shelf registration / ATM / convertibles | None on file — no S-3 or 424B in the filing record reviewed (June 2025 – August 2026); no at-the-market, shelf, or convertible language in the latest 10-Q | Verified | SEC EDGAR filing index, CIK 0000723125; Form 10-Q text |
| Insider sales, 12 months (all officers and directors) | ≈799,000 shares / ≈$354M total; ≈86% of proceeds under pre-scheduled 10b5-1 plans | Estimate | Computed from SEC EDGAR Forms 4, Sept 2025 – July 2026 (share counts Verified per filing; aggregation and proceeds derived) |
| Director open-market purchase | 23,200 shares at ≈$337 (1/13-1/14/26, ≈$7.8M) | Verified | SEC EDGAR Form 4, acc. 0002058769-26-000002 |
| Analyst consensus | 38 analysts, consensus Buy, average price target $1,259.97 (4 strong buy / 32 buy / 2 hold / 0 sell); a second aggregator showed ≈$1,501.98 on 8/14 — the aggregators disagree | Estimate | Public aggregators: MarketBeat (8/18); financial press (8/14) |
| Recent analyst actions | Upgrade to Buy, $1,250 target (New Street, 8/14); price-target cut $1,400 → $1,150, Buy maintained (Citigroup, 8/7) | Estimate | Public aggregator listings (MarketBeat) |
| Next earnings date | ≈September 22, 2026 (fiscal Q4) | Unverified | Estimated from past reporting cadence; not company-announced in the record reviewed |
| Netlist patent actions against Micron | ITC complaint (with Supermicro, HPE, Lenovo as co-respondents) and a Central District of California suit over DDR5 RDIMM/MRDIMM products; exclusion and cease-and-desist orders sought | Verified | Netlist press release, 8/12/26 (PR Newswire) |
| Strategic Customer Agreements — scale | Press accounts of the 6/24 earnings call describe 16 agreements covering ≈$100B of minimum committed revenue; the 10-Q confirms take-or-pay agreements with ≈$5B of customer-deposit obligations | Unverified | $100B figure: financial press; take-or-pay structure and deposits: Form 10-Q (Verified) |
| 2027 industry DRAM/HBM capacity reported "fully allocated" | Trade-press reporting; a key driver of the August recovery narrative | Unverified | Trade press (secondary) |
| Moving averages, RSI, ATR, pivots, anchored VWAPs | SMA20 $897.37 · SMA50 $961.03 · SMA100 $784.38 · SMA200 $556.55 · RSI(14) 59.5 · ATR(14) ≈$72 (7.1%) | Estimate | Derived from daily closing prices (conventions described in the body) |
Price Chart
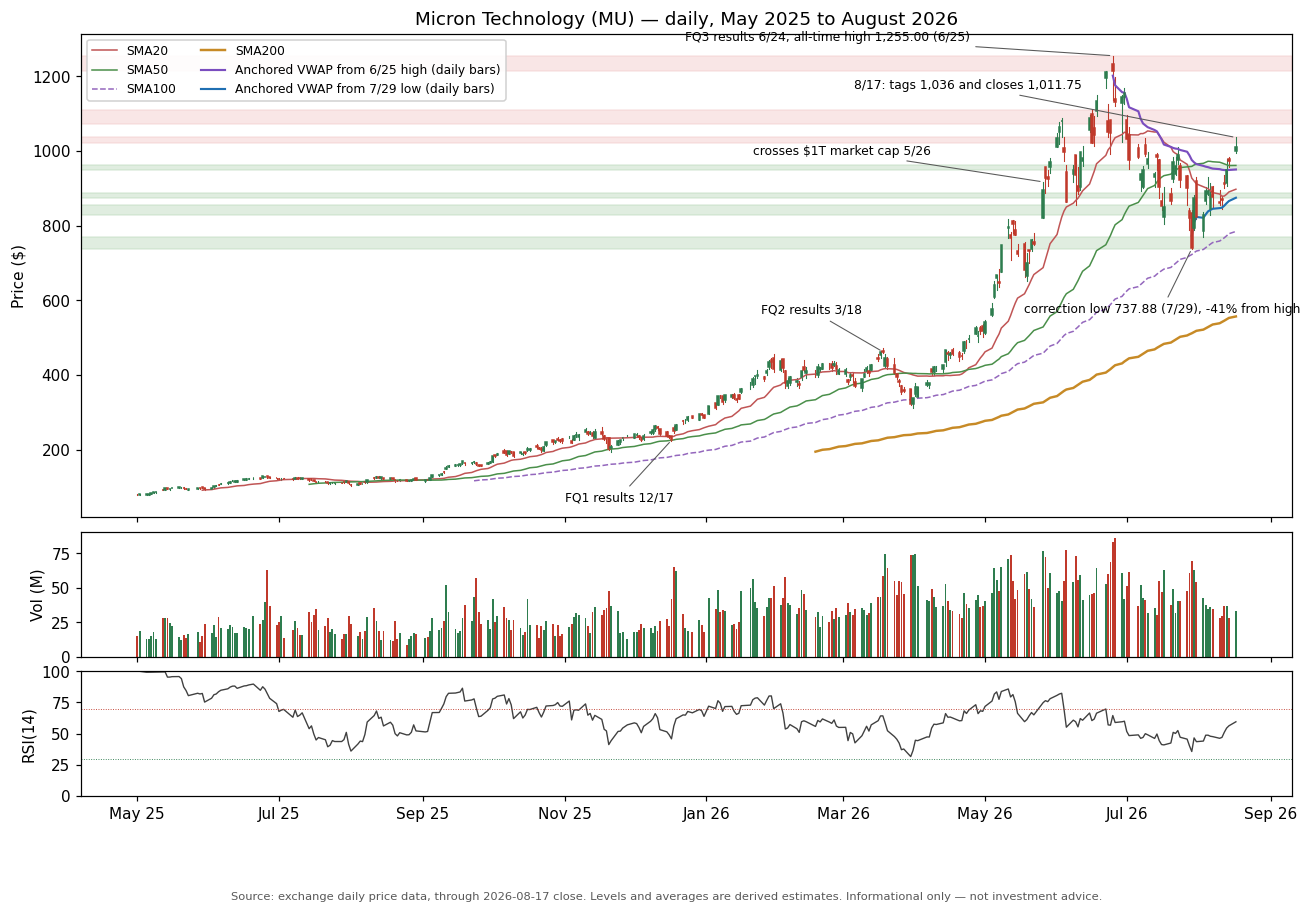
Micron Technology (MU), daily candlesticks May 2025 – August 2026, with volume and RSI panels, moving averages, anchored VWAPs from the June 25 high and July 29 low, and the key support/resistance bands. As of the 2026-08-17 close.
Trend and Moving-Average Structure
At the August 17 close of $1,011.75, the stock sits above all four widely watched moving averages (a moving average is the average closing price over the last N trading days — a trend line that smooths out daily noise): the 20-day at approximately $897, the 50-day at approximately $961, the 100-day at approximately $784, and the 200-day at approximately $557. The long-term picture is unambiguous: the 200-day average is rising steeply, the 50-day average has been above the 200-day for the entire fifteen-month window reviewed (no crossover event occurred), and even the July collapse to $737.88 never came close to testing the 200-day line.
The medium-term structure is in repair rather than fully restored. The July correction pulled the 20-day average (≈$897) below the 50-day (≈$961), and that ordering has not yet reversed — a configuration typical of a market recovering from a damaging decline rather than one in a settled uptrend. Price reclaimed both averages during the August rebound, which is constructive, but this morning's premarket decline to approximately $962 places the tape directly on the 50-day line. Whether that line holds on a closing basis is the immediate trend question; below it, the 20-day at $897 and the monthly pivot zone near $886 are the next reference points.
Support and Resistance
Support
| Level | Basis | Role |
|---|---|---|
| $995–1,000 | Round number; 8/17 session low $995.26 | First intraday support (psychological) |
| $950–961 | Anchored VWAP from the 6/25 high ($950.28) + 50-day moving average ($961.03) + 8/14 hammer low ($956.20) | First structural support — the key band; being tested premarket |
| $933.40 | Weekly floor-trader pivot (derived) | Support / tactical pivot |
| $897 | 20-day moving average | Support |
| $874–886 | Anchored VWAP from the 7/29 low ($874.54) + monthly floor-trader pivot ($886.00) + weekly S1 ($882.90) — a three-way confluence | Second structural support |
| $827–854 | Early-August base: 8/6 low $827.00, 8/11 low $844.62, 8/10 low $854.40 | Support — the recovery's foundation; invalidation zone |
| $794 | Weekly S2 floor-trader pivot (derived) | Support |
| $738–770 | Correction low $737.88 (7/29) and 8/3 low $770.10 | Major support — the July capitulation zone |
Resistance
| Level | Basis | Role |
|---|---|---|
| $1,022 | Weekly R1 floor-trader pivot (derived) | First resistance |
| $1,034–1,036 | Monthly R1 pivot ($1,034.10) + 8/17 intraday high ($1,036.13) — price was rejected here | Resistance — the confirmation level for the recovery |
| $1,073 | Weekly R2 floor-trader pivot (derived) | Resistance |
| $1,097–1,110 | Mid-June congestion: 6/15–6/17 session highs | Resistance — the upside objective zone if $1,036 is reclaimed |
| $1,149–1,169 | 6/18 high $1,149.43 and 6/30 high $1,168.68 | Resistance |
| $1,213–1,255 | 6/22 close $1,211.38 and the 6/25 all-time high $1,255.00 | Major ceiling — the prior blow-off zone |
Momentum
The recovery off the July 29 low has been powerful but is maturing. Price rose about 37% in thirteen sessions — from $737.88 to the August 17 close of $1,011.75 — and the RSI (Relative Strength Index, a 0-100 gauge of how fast and far price has recently moved) stands at 59.5: recovered from the July washout, yet not at the overbought extremes (above ~70) that marked the May-June run. That mid-zone reading leaves room in either direction.
The caveat is volume. The rebound has come on fading participation: average daily volume over the last ten sessions is approximately 33.5 million shares, versus roughly 42 million over thirty sessions and 49 million over sixty. Price momentum is positive while volume momentum is not — a divergence. Recoveries that stall tend to stall exactly this way, drifting up on thinning volume into resistance; the constructive resolution would be a push through the $1,022-$1,036 zone on expanding volume. Until one of those happens, the honest description is: strong tape, thinner conviction.
Daily ranges remain extraordinary. The 14-day average true range is approximately $72, about 7.1% of the share price, and the fifteen-month window contains 28 sessions with closing moves of 8% or more. This is a stock that routinely moves in a day what an index moves in a quarter — momentum readings here describe a fast tape, not a calm one.
Pattern Read
No single textbook pattern governs this chart, and the report will not force one. The structure since the July low is best described as a V-shaped recovery built on a chain of rising lows — $737.88 (7/29), $770.10 (8/3), $827.00 (8/6), $844.62 (8/11), $854.40 (8/10), $899.54 (8/12), $956.20 (8/14) — buyers stepping in at successively higher levels, which is the recovery's defining evidence.
The actionable read is a level-reclaim sequence. On August 12 the stock reclaimed the average cost of every buyer since the July low (the anchored VWAP from 7/29, then near $860); on August 13-17 it reclaimed the average cost of every buyer since the June top (the anchored VWAP from 6/25, at $950.28), the 50-day average, and the $1,000 round number. August 17 then tagged $1,036.13 — almost exactly the monthly R1 pivot at $1,034 — and faded to close at $1,011.75. That leaves $1,022-$1,036 as the confirmation zone above and $950-$961 as the proof-of-support zone below, with this morning's premarket decline delivering the retest of the lower band immediately.
The candlestick scan over the last sixty sessions (formations are only treated as signals when they print at a level that matters) found three that qualify. First, a shooting star on August 5 near the weekly pivot — a long upper wick showing buyers pushed price up and were sold back down — which was confirmed lower over the next two sessions. Second, back-to-back dojis (indecision candles) on August 10-11 sitting on the recovery-cost zone, which resolved upward on August 12. Third, and most recently, a hammer on August 14 whose low of $956.20 printed exactly on the $950-$961 band; the August 17 close above the hammer's high confirmed it — the standard confirmation — making it the most recent completed signal on the chart, and a bullish one. That hammer signal is now being stress-tested: a daily close below the $950 band would negate it.
| Pattern | Status | Confirmation trigger | Target | Reliability |
|---|---|---|---|---|
| V-recovery with rising-lows chain | Forming — intact above $854 | Daily close above $1,036 (8/17 high / monthly R1) | $1,072–1,110 (next resistance shelf; level-to-level projection — no classic measure rule applies) | Moderate — structure clean, but the advance is on fading volume |
| Level reclaim: $950–961 band (average-buyer cost from the top + 50-day average) | Reclaimed 8/13–8/17; under retest premarket 8/18 | Holds on a daily-close basis | Acceptance above the band re-opens $1,022–1,036 | The heavily-tested basis (two independent conventions in one band) strengthens the level |
| Hammer (candlestick), 8/14, at the $950–961 band | Confirmed by the 8/17 close above its high | Already confirmed; negated by a daily close below $950 | Follow-through toward $1,072–1,110 per the recovery structure | Confirmed single-candle signals are hints, not guarantees — context (the band) is what gives it weight |
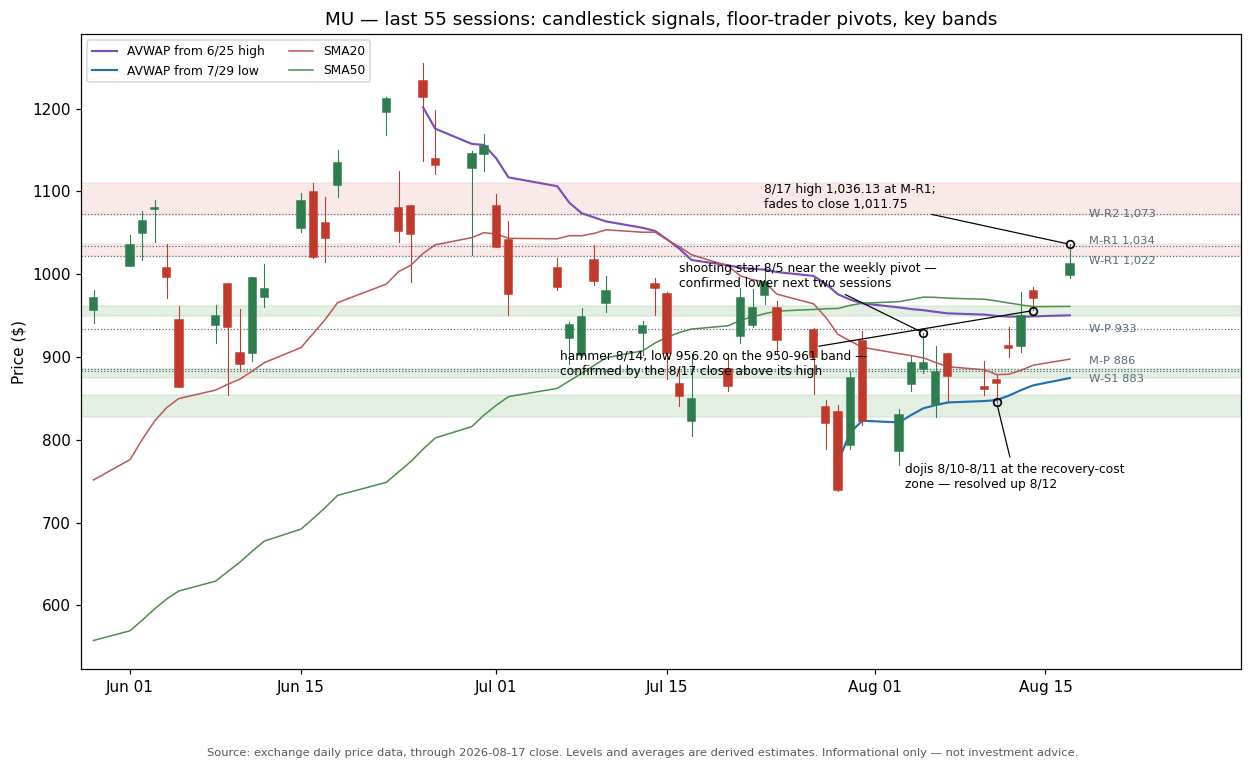
MU, last 55 sessions: detected candlestick signals annotated at the levels they printed against, with weekly/monthly floor-trader pivot lines and the key support/resistance bands. Pivots and levels are derived estimates.
Valuation and Returns Trend
Direction against the company's own history, not absolute level, is the question here — and the direction of every operating measure is up at a rate with few precedents in large-cap history, while the market's forward pricing of those earnings has become more skeptical, not less.
| Measure | Latest | Prior | Direction | Read |
|---|---|---|---|---|
| Revenue (fiscal Q3, year over year) | $41.456B | $9.301B | Improving | More than quadrupled; three consecutive quarters of acceleration ($13.6B → $23.9B → $41.5B) |
| GAAP gross margin | 84.6% | 37.7% | Improving | Pricing power at a level normally seen in software, not hardware — the cycle's central exhibit |
| GAAP net income (fiscal Q3) | $28.243B | $1.885B | Improving | Single-quarter net income now exceeds the full prior fiscal year's |
| Operating cash flow (fiscal Q3) | $25.39B | $4.61B | Improving | Cash generation confirms the income statement; adjusted free cash flow $18.3B in the quarter |
| Return on equity (trailing 12 months, approximate) | ≈65% | ≈17% (FY2025) | Improving | Computed on average equity; equity itself nearly doubled over the fiscal year to date |
| Price-to-earnings (trailing GAAP, approximate) | ≈22× | ≈15× (a year ago) | Flat-to-higher | Modest expansion — far less than earnings growth would mechanically produce |
The telling gap is between the trailing and forward multiples. At roughly 22 times trailing earnings but only around 8 times the earnings run-rate implied by the company's own fiscal Q4 guidance (and single-digit multiples of published consensus forward estimates), the market is explicitly declining to pay full price for the current earnings level — a cycle-durability discount. Memory has always been cyclical, and the forward multiple says investors expect these margins to mean-revert. The company's counter-argument is structural: multi-year take-or-pay Strategic Customer Agreements intended to make the revenue durable and predictable. Which side is right is the entire debate in this stock, and the fiscal Q4 report and its guidance are the next scheduled test.
Momentum Attribution and Catalyst Analysis
What moved this stock, precisely, in each phase:
The advance (September 2025 – June 2026). The driver was the AI memory shortage arriving in the income statement. Each earnings report beat the prior one by a widening margin: fiscal Q1 (reported 12/17, +10.2% next session), fiscal Q2 (reported 3/18: $23.86B revenue, 74.4% gross margin), and fiscal Q3 (reported 6/24 after the close: $41.46B revenue, 84.6% gross margin, $24.67 GAAP EPS — the stock gapped up 15.7% on 6/25 to the $1,255.00 all-time high). Along the way the company crossed $1 trillion of market value for the first time on May 26 (a +19.3% session that press reports tied to an analyst target increase on AI optimism). Management's strategic move, announced with the Q3 report, was the Strategic Customer Agreements: multi-year take-or-pay contracts (customers pay for contracted volumes whether or not they take delivery) intended to convert a cyclical shortage into contracted, durable revenue. The 10-Q confirms the take-or-pay structure and approximately $5 billion of customer-deposit obligations; press accounts of the earnings call describe 16 agreements covering roughly $100 billion of minimum committed revenue (that larger figure is not confirmed in the filings reviewed).
The correction (June 25 – July 29, −41%). No single company disclosure caused it — fiscal Q3 was a record and guidance was raised. The pressure came from the supply side of the cycle: announced capacity expansions across the industry (press coverage cites a large competitor fab-expansion program), the July 27 stock-market debut of China's ChangXin Memory Technologies (CXMT) signaling new entrant capacity, a sharp one-month decline in the Korean market that dragged global memory names down together, and research notes warning that memory prices could peak in 2027. Sector peers fell 30-50% from their highs over the same stretch — this was a memory-complex repricing, not a Micron-specific event.
The recovery (July 29 – August 17, +37%). Also sector-wide and fundamentals-flavored: trade-press reporting that 2027 DRAM and HBM industry capacity is already fully allocated (customers reportedly receiving only 60-70% of requested volumes), research commentary that the HBM shortage should intensify rather than ease in 2027, and continued sold-out conditions. Within that recovery, Citigroup cut its price target from $1,400 to $1,150 on August 7 while keeping its Buy rating (citing a 2027 memory-price peak), and New Street upgraded to Buy with a $1,250 target on August 14 — disagreement about the cycle's length, not about current business strength.
Today (August 18). Press coverage ties the premarket decline (≈−4.9% to about $962) to the Netlist patent actions announced August 12 — an International Trade Commission complaint naming Micron (with Supermicro, HPE, and Lenovo as co-respondents) and a federal suit in the Central District of California, both over DDR5 server-memory modules, seeking exclusion orders that could in principle bar affected products from U.S. import — together with broader memory-sector profit-taking. Two things are worth keeping in proportion: ITC proceedings are slow (institution of an investigation alone typically takes about a month, and resolution far longer), and the attribution of any single morning's move to any single headline is inference, not fact.
Is it priced in? The stock trades at roughly 22 times trailing earnings and single-digit multiples of guided forward earnings — the market is already discounting substantial mean-reversion in memory pricing. That makes the setup asymmetric around evidence of durability: confirmation (fiscal Q4 results at or above the $49-51 billion guidance, further contracted-revenue disclosure) challenges the discount, while any crack in the supply-shortage narrative (competitor capacity, softening spot prices) feeds the correction case. The fiscal Q4 report, estimated for on or about September 22, is the next scheduled adjudication.
Catalyst Calendar
Dated events that can move the stock. Status marks whether the date is confirmed by a primary source or estimated.
| Date | Event | Status | Read |
|---|---|---|---|
| ≈2026-09-22 | Fiscal Q4 2026 results (guidance: revenue $50.0B ± $1.0B, non-GAAP EPS $31.00 ± $1.00, gross margin ≈86%) | Estimate | The decisive scheduled event — the first test of guidance-level durability |
| ≈2026-09 (mid) | ITC decision on whether to institute an investigation on Netlist's 8/12 complaint (institution typically follows filing by about a month) | Estimate | Procedural step; exclusion-order risk, if any, is long-dated |
| ≈2026-10 (early) | Fiscal 2026 Form 10-K annual report (prior-year precedent: filed 10/3) | Estimate | Full-year accounts; capital-expenditure plans and contracted-revenue disclosure worth reading closely |
| ≈2026-09/10 | Next quarterly dividend declaration (current rate $0.15 per share, raised from $0.115 in fiscal Q3) | Estimate | Small in yield terms; the trajectory is the signal |
Insider Activity
Over the twelve months reviewed (Forms 4 filed September 2025 through July 2026, SEC EDGAR, CIK 0000723125), officers and directors sold approximately 799,000 shares for approximately $354 million, and bought 23,200 shares for approximately $7.8 million. The headline number looks large; the composition is what matters. Approximately 86% of the sale proceeds came from sales flagged on the Form 4s as executed under pre-scheduled Rule 10b5-1 plans (automatic selling programs set up in advance, which carry less information than in-the-moment selling). The chief executive's record is the clearest illustration: he sold in essentially every month from September 2025 through July 2026 — at prices from roughly $130 to roughly $1,190 — the same clockwork cadence at the bottom of the range as at the top, which is the signature of a programmatic diversification plan rather than of timing. A large October 2025 cluster across the entire executive team was the annual equity-award vesting cycle (option exercises and tax-withholding share surrenders at a common $181.60 exercise event), which is compensation mechanics, not market signal. Discretionary open-market sales — the category that would carry signal — totaled only about $43 million across twelve months (largest single instances: an EVP's ≈$10.5M in April and ≈$10.7M in February), scattered across levels, with no cluster at the June top. On the other side of the ledger, one director made open-market purchases of 23,200 shares at about $337 in mid-January 2026. There were no open-market purchases by officers.
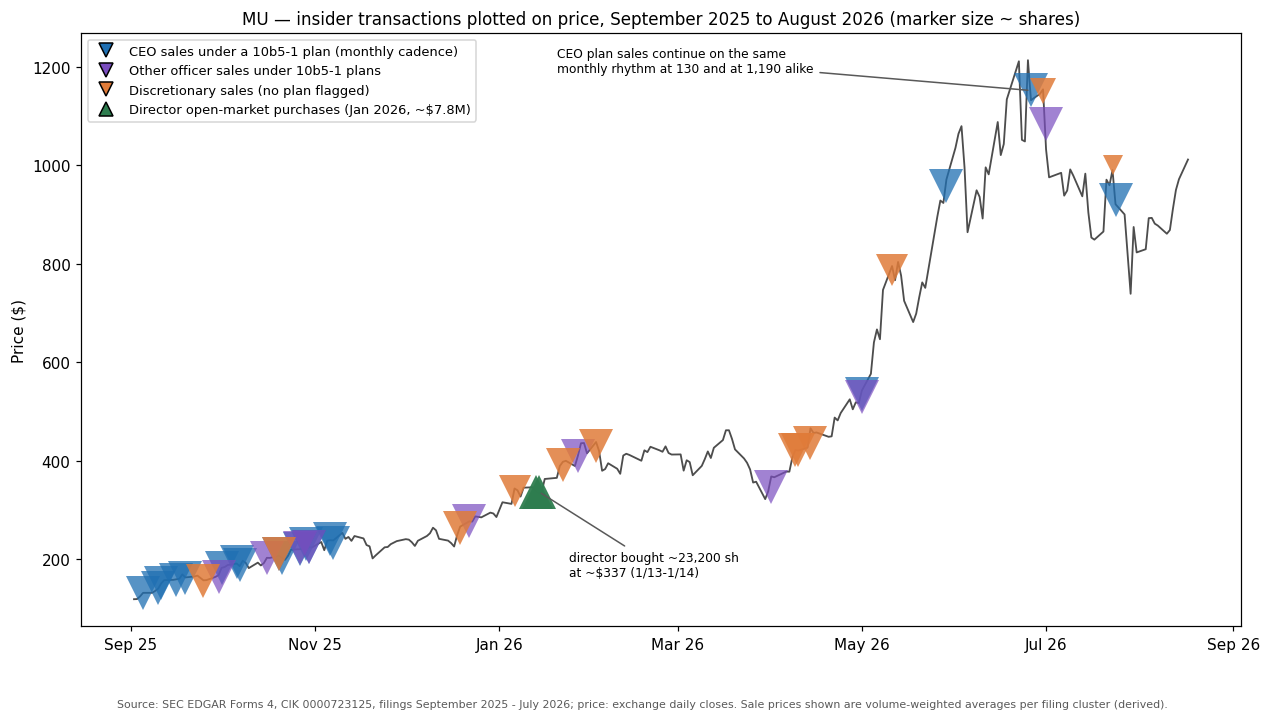
Insider transactions plotted on price, September 2025 – August 2026. The cadence test: plan sales recur monthly across a ten-fold price range, and no discretionary cluster appears at the June top. Marker size is proportional to shares.
| Insider | Title | Date | Type | Shares | Price | Held after |
|---|---|---|---|---|---|---|
| Mehrotra, Sanjay | Chairman, President & CEO | 2026-07-24 | Sale (10b5-1 plan) | 37,343 | $906–966 (VWAP by lot) | 304,503 |
| Mehrotra, Sanjay | Chairman, President & CEO | 2026-06-26 | Sale (10b5-1 plan) | 48,496 | $1,128–1,192 | 344,503 |
| Mehrotra, Sanjay | Chairman, President & CEO | 2026-05-29 | Sale (10b5-1 plan) | 46,270 | $942–979 | 384,503 |
| Mehrotra, Sanjay | Chairman, President & CEO | 2026-05-01 | Sale (10b5-1 plan) | 40,059 | $512–545 | 424,503 |
| Mehrotra, Sanjay | Chairman, President & CEO | Sep 2025 – Nov 2025 (14 sessions) | Sales (10b5-1 plan) | ≈170,000 | $131–241 | — |
| Arnzen, April | EVP & Chief People Officer | 2026-07-01 | Sale (10b5-1 plan) | 40,000 | $1,077–1,096 | 85,737 |
| Arnzen, April | EVP & Chief People Officer | 2026-04-01 | Sale (10b5-1 plan) | 40,000 | $345–348 | 125,737 |
| Murphy, Mark | EVP & Chief Financial Officer | 2025-10-30 | Sale (10b5-1 plan) | 126,000 | ≈$225.31 | — |
| Deboer, Scott | EVP, CTO & Products Officer | 2025-10-27 | Sale (10b5-1 plan) | 82,000 | ≈$222.81 | — |
| Ray, Michael | SVP & Chief Legal Officer | 2026-05-01 | Sale (10b5-1 plan) | 7,501 | $512–545 | 67,227 |
| Sadana, Sumit | EVP & Chief Business Officer | 2026-04-10 | Sale (discretionary — no plan flagged) | 24,000 | ≈$421.35 | 224,021 |
| Sadana, Sumit | EVP & Chief Business Officer | 2026-02-02 | Sale (discretionary — no plan flagged) | 25,000 | ≈$429.89 | — |
| Bhatia, Manish | EVP, Global Operations | 2026-01-22 | Sale (discretionary — no plan flagged) | 26,623 | ≈$391 | — |
| Allen, Scott | CVP, Chief Accounting Officer | 2026-07-23 | Sale (discretionary — no plan flagged) | 879 | $1,000.00 | 34,958 |
| Dugle, Lynn (Director) | Director | 2026-06-30 | Sale (discretionary — no plan flagged) | 1,300 | $1,150.43 | 17,728 |
| Liu, Teyin (Director) | Director | 2026-01-13 / 01-14 | PURCHASE (open market) | 23,200 | ≈$337 | 25,910 |
Distress / dilution-anticipation read
Insider Form 4 filings never state motive; the classification below is an inference from the constellation of signals, each checked against a primary source.
| Factor | Finding | Read |
|---|---|---|
| Active ATM or shelf (a dilution vehicle insiders might front-run) | None on file — no S-3/424B in the filing record reviewed, and the latest 10-Q contains no at-the-market or shelf-registration language | Rules out the dilution-anticipation hypothesis |
| Financial distress | The opposite: $25.0B cash ($30.2B with investments), long-term debt below $9B and being retired early via cash tender offers (8-K, 3/25/26), no going-concern language | Rules out the distress-exit hypothesis |
| 10b5-1 plan status | The largest sellers (CEO, CPO, CFO, CTO, CLO) carry the plan flag on their Forms 4; ≈86% of 12-month proceeds are plan-flagged | Pre-scheduled selling — materially softer signal |
| Transaction character | October 2025 cluster = annual vesting/withholding cycle at a common exercise event; recurring monthly CEO cadence | Programmatic compensation mechanics, not opportunistic timing |
| Timing vs. the top | No discretionary C-suite cluster at the June top; discretionary sales were comparatively small and scattered across price levels from $155 to $1,150 | The 'sold the top' pattern is absent |
| Prior cadence (the setup test) | The CEO sold on the same monthly rhythm at ≈$130 as at ≈$1,190 | Price-insensitive selling — strong evidence against foreknowledge-driven timing |
| Offsetting buys | A director bought 23,200 shares (≈$7.8M) in the open market in January 2026; no officer open-market purchases | A modest counter-signal on the buy side |
Assessment: Routine
Form 4 filings never state motive; this classification is an inference from the constellation of checks above, each tied to a primary source. The two hypotheses that would make heavy insider selling alarming — selling ahead of dilution, and selling out of a distressed balance sheet — are both affirmatively ruled out by the filing record (no shelf or ATM exists; the balance sheet is adding roughly $46 billion of equity a year). What remains is large but programmatic diversification by executives whose equity compensation has appreciated roughly ten-fold in a year, executed overwhelmingly under pre-scheduled plans on a cadence that ignores price. Not verified at this depth: the full option-grant overhang (the complete schedule of future exercisable awards), and any Form 4 activity after July 28, 2026 (the most recent filing reviewed).
Analyst Coverage
38 covering analysts · consensus rating Buy · PT mean 1,259.97 · distribution 4 strong buy · 32 buy · 2 hold · 0 sell
Delta since last print: Coverage remained active through both the post-earnings surge and the July correction; the most recent actions run in both directions (an upgrade on 8/14; a target cut, rating maintained, on 8/7).
As of: 2026-08-18 · Source: Public aggregators: MarketBeat (8/18); a second aggregator showed ≈$1,501.98 average target across ≈45 ratings on 8/14 — the aggregators disagree materially on the average
Recent actions: At least six published actions in the last 30 days: one upgrade (New Street, Neutral to Buy, $1,250 target, 8/14), one price-target cut (Citigroup, $1,400 to $1,150, Buy maintained, 8/7), and multiple reiterations (UBS 8/10; KeyBanc 7/20; TD Cowen 7/10) — with every published target above the current share price. Earlier in the window, targets as high as $1,750 (KeyBanc, 7/14) and $2,000 (Cantor Fitzgerald, 6/29) were published near the top of the range.
Staleness matrix
For each covering firm: how many trading sessions since its last published update, the specific material events not addressed in that published record, and the staleness reading. Readings: Fresh (published since the most recent material event), Aging (no update through one material event), Stale (material events unaddressed in the published record), or Withdrawn (coverage recorded as discontinued). The named events are the evidence for the reading. This describes the PUBLISHED RECORD only — it does not describe any firm's current internal view, which is not observable.
| Firm | Last published | Days since | Events not addressed | Reading |
|---|---|---|---|---|
| New Street Research | 2026-08-14 | 2 | None (no earnings print or material 8-K since the 6/24 results) | Fresh |
| UBS | 2026-08-10 | 6 | None | Fresh |
| Citigroup | 2026-08-07 | 7 | None | Fresh |
| KeyBanc Capital Markets | 2026-07-20 | 20 | None | Fresh |
| TD Cowen | 2026-07-10 | 27 | None | Fresh |
| Cantor Fitzgerald | 2026-06-29 | 35 | No earnings print or material 8-K since; the intervening −41% correction and recovery are a market event, not a company disclosure | Aging |
Contradiction check
Where a firm's published position and the subsequent record diverge — a price target the market has traded through with no update since, a published statement the company's own later disclosure differs from, or no publication following a material event. Each row states the published position, what the record shows happened, and the source for both. It draws no conclusion about the firm, its analysis or its motives, and no inference should be read into it.
| Firm | Published | Published position | What the record shows | Observation | Source |
|---|---|---|---|---|---|
| Cantor Fitzgerald | 2026-06-29 | Overweight, $2,000 price target (published within days of the all-time high) | The stock subsequently declined as much as 41% (to $737.88 on 7/29) and trades ≈49% below the target; no updated publication was located in the public record reviewed | Price traded through target; no update published since | Public aggregator listings (MarketBeat; financial press, 8/3/26) |
Assessment
Grade: Aligned
Coverage of this name is large (roughly 38-45 firms depending on aggregator), active, and responsive: the firms with the most recent published records updated through the correction and recovery, in both directions, and there are no published sell ratings. One row merits attention rather than alarm — a $2,000 target published near the top with no located update since (the public record reviewed may be incomplete; the firm may have published behind its paywall). The more practically important finding for a reader is that the public aggregators disagree materially about the consensus average target ($1,259.97 versus $1,501.98, sampled four days apart with different analyst counts) — anyone quoting 'the consensus' on this stock should check which aggregator, with what count, on what date. All figures here are from public aggregators, not from the covering firms directly.
Capital Structure and Corporate-Action Context
Share count: 1,129,393,151 shares outstanding as of June 17, 2026 (10-Q cover) — up just 0.6% over the fiscal year to date, essentially all from employee equity compensation, partly offset by buybacks. There is no shelf registration, no at-the-market program, no convertible debt, and no warrant overhang in the filing record reviewed — for a company generating this much cash there is simply no dilution machinery on file.
Balance sheet: $24.995 billion of cash and equivalents at May 28, 2026 ($30.2 billion including marketable investments), against long-term debt of $8.844 billion at last report (November 27, 2025) — and shrinking: on March 25, 2026 the company announced cash tender offers to retire its 2031-2035 senior notes early (8-K, Item 8.01). Stockholders' equity nearly doubled over the fiscal year to date, from $54.165 billion to $100.724 billion, on retained earnings. The mega-cap failure mode — borrowing to fund buybacks while equity hollows out — is the opposite of what this filing record shows: equity is compounding while debt is being retired.
Capital returns are modest relative to earnings: $650 million of buybacks in the first nine months of fiscal 2026 (2.5 million shares; none in the third quarter; $7.84 billion cumulative under the May 2018 authorization), and a quarterly dividend just raised from $0.115 to $0.15 per share. The 10-Q notes that repurchases are subject to restrictions under the company's CHIPS Act direct-funding agreements — a structural governor on buybacks worth knowing about. The heavy use of cash is capital expenditure: $19.6 billion in the first nine months, with management stating it is 'investing at record levels' in supply.
The Strategic Customer Agreements are the notable new structure: multi-year take-or-pay contracts (the 10-Q confirms the structure and approximately $5 billion of customer-deposit obligations, with press accounts of the earnings call describing 16 agreements covering roughly $100 billion of minimum committed revenue — that larger figure is not confirmed in the filings reviewed). These cut both ways: they convert cyclical demand into contracted revenue, and they also commit both sides to volumes across a cycle whose pricing no one can guarantee.
Recent 8-K record: fiscal Q3 results (6/24, Item 2.02); an executive appointment (6/9, Item 5.02); the debt tender offers (3/25, Item 8.01); annual-meeting items including a charter amendment approved by shareholders (1/21, Items 5.03/5.07).
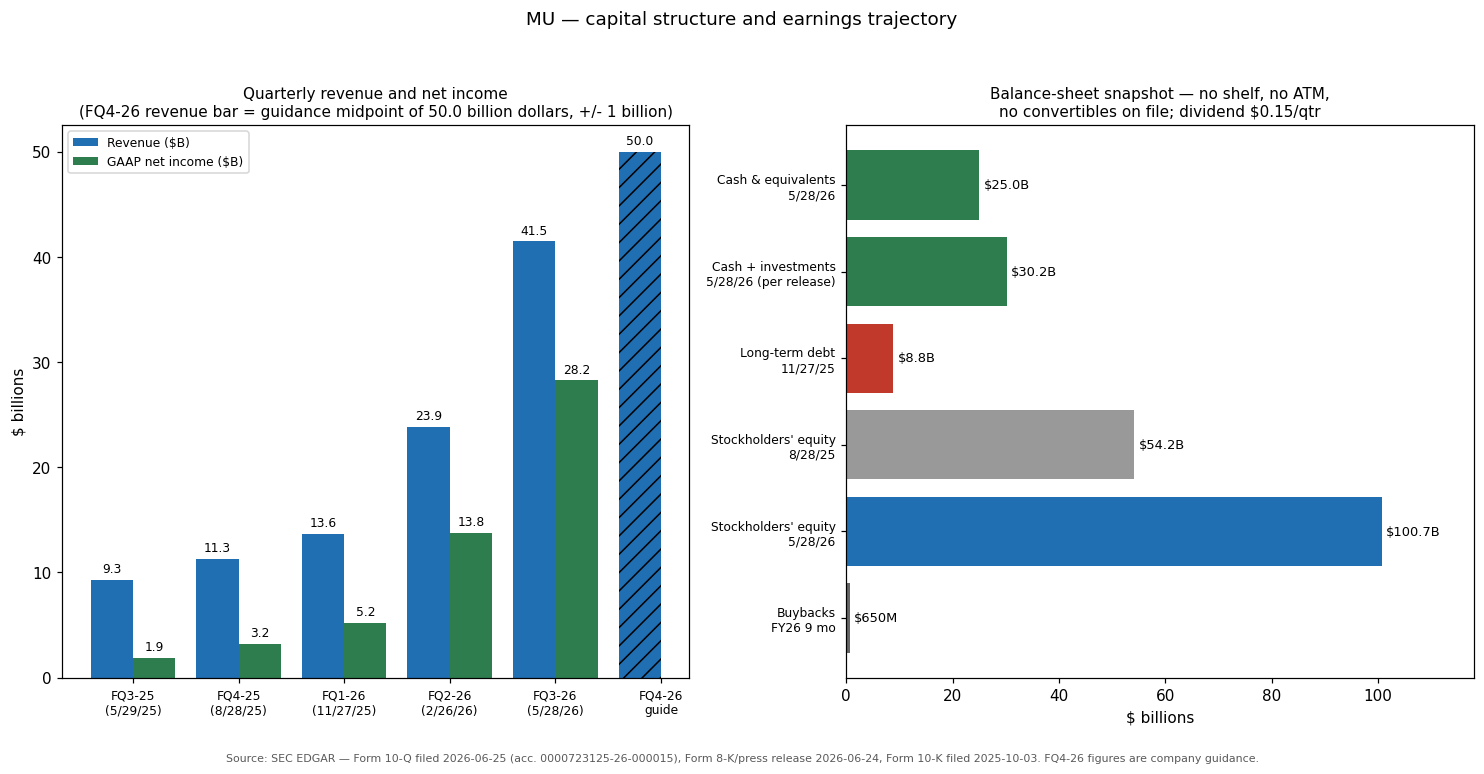
Capital structure and earnings trajectory, from SEC filings: quarterly revenue and net income through fiscal Q3 2026 with the fiscal Q4 guidance midpoint, and the balance-sheet snapshot. All figures as filed; fiscal Q4 bar is company guidance.
Stockholders' Equity Flag Scan
Cap segment: large/mega — flag emphasis calibrated accordingly.
The scan below reads the equity section of the latest 10-Q (quarter ended May 28, 2026) — the share rollforward and balance-sheet equity — and, because this is a trillion-dollar company, applies the large-cap lens: the classic small-cap dilution flags matter less than the borrow-to-grow overlay (is debt growing faster than cash flow, are buybacks debt-funded, is equity eroding). Every finding runs the opposite direction: share count grew 0.6% fiscal-year-to-date (1,122.5M at the September 2025 cover to 1,129.4M at the June 2026 cover), all of it employee-compensation issuance; equity nearly doubled on retained earnings; debt is being retired early out of cash.
Dilution waterfall (share issuance by source)
| Source | Shares | % of dilution | Note |
|---|---|---|---|
| Employee equity awards (RSU vesting, option exercises, employee stock plan) | ≈+9.4M gross (Estimate) | ≈100% of gross issuance | Derived from cover-page share counts and 10-Q equity statements; the October 2025 Form 4 cluster shows the annual vesting event |
| Share repurchases | −2.5M | offset | $650M in the first nine months of FY26; none in FQ3 |
| Equity facility / ATM draws | 0 | — | No facility exists |
| Dividends paid in stock | 0 | — | Dividends are paid in cash ($0.15/quarter) |
| Convertible or warrant exercises | 0 | — | No convertibles or warrants on file |
Dilution and share-count review
| Flag | Finding | Read |
|---|---|---|
| Total share-count change | +0.6% fiscal-year-to-date (1,122.5M → 1,129.4M) | Clean — de-minimis for a mega cap, fully attributed to compensation |
| Dilution by source | All identified issuance is employee-compensation-driven; no external issuance of any kind | Clean |
| Equity-facility / ATM usage | None exists | Clean — the strongest possible finding on this flag |
| Treasury / buyback activity | $650M FY26 to date; $7.84B cumulative; paused in FQ3; CHIPS Act funding agreements restrict repurchases | Clean, with a note: capital returns are small relative to ≈$45.7B nine-month operating cash flow — cash is going to capacity instead |
| Retained earnings / accumulated-deficit trajectory | Retained earnings $94.7B and rising steeply; equity $54.2B → $100.7B fiscal-year-to-date | Clean |
| Leverage overlay (the mega-cap lens) | Long-term debt $8.8B at last report and being tendered early; operating cash flow $45.7B in nine months against $19.6B capex; strongly net-cash | Clean — the borrow-to-grow failure mode is absent; growth is internally funded |
| Convertible / preferred overhang | None on file | Clean |
| Authorized-share / structural changes | Charter amendment approved at the January 2026 annual meeting (8-K Item 5.03); no reverse split, no authorization-increase-as-dilution-prep pattern | Clean on the evidence reviewed; the amendment's terms were not examined at this depth |
Assessment
Clean
No dilution risk of any materiality exists in this filing record, and the large-cap leverage overlay is emphatically clean — equity compounding, debt shrinking, growth internally funded. The two forward items worth watching are commitments rather than flags: capital expenditure is guided to record levels (the cash consumer that, in past memory cycles, marked tops when the whole industry did it simultaneously), and the take-or-pay Strategic Customer Agreements bind future volumes in both directions. Neither is a present-tense balance-sheet concern.
Invalidation Conditions
A daily close below $950 — first-support failure: negates the confirmed 8/14 hammer signal and puts the stock back below the average cost of every buyer since the June top.
A daily close below $886 — loss of the three-way confluence (recovery-buyer average cost, monthly pivot, weekly S1): the recovery thesis is materially weakened and the $827-$854 base becomes the decision zone.
A daily close below $827 — the rising-lows chain from the July 29 bottom is broken: the recovery read is invalidated outright, and a retest of $738-$770 is the operative map.
A breakout failure — a daily close above $1,036 that is followed within two sessions by a close back below $1,022 is a failed breakout and should be treated as bearish, not bullish.
A catalyst reversal — fiscal Q4 results below the guidance floor ($49.0B revenue or ≈86% gross margin missed materially), or a credible report of 2027 capacity coming un-allocated / memory spot prices rolling over.
A legal escalation — ITC institution followed by adverse early procedural rulings on the Netlist complaint would layer a non-technical overhang onto the chart that these levels do not capture.
Directional Scenarios
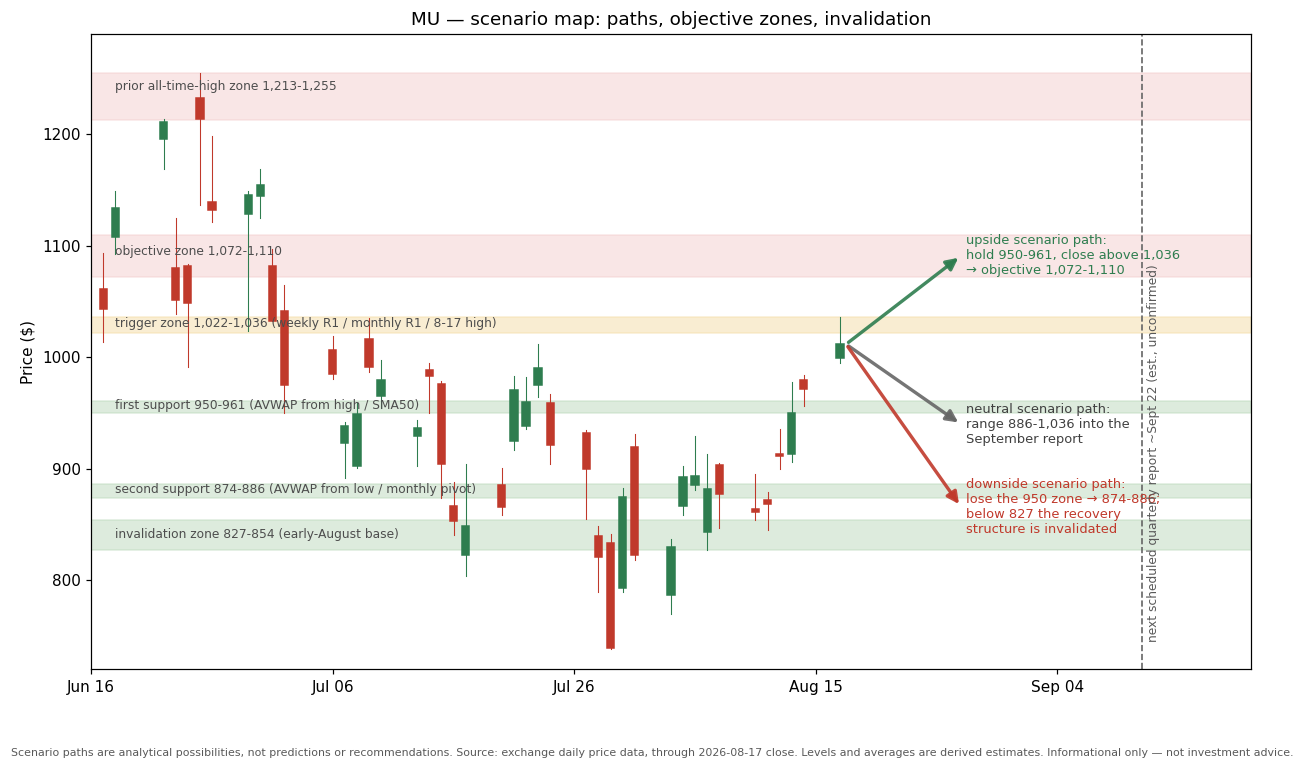
Scenario map: the three paths, their trigger and objective zones, and the invalidation levels, drawn on the recent tape. Scenario paths are analytical possibilities, not predictions or recommendations.
Downside scenario
The band fails. A daily close below $950 negates the hammer and the reclaim, exposing the weekly pivot at $933 and then the $874-$886 confluence. A close below $886 escalates the correction case: $827-$854 (the early-August base) is the last structural support of the recovery, and below $827 the rising-lows chain is broken — at that point the recovery read is wrong, the $794 weekly S2 and the $738-$770 capitulation zone are the operative levels, and the pre-earnings setup becomes a broken chart rather than a consolidation.
Upside scenario
The band holds and the reclaim completes. Price defends $950-$961 on a closing basis (this morning's premarket test resolving as a successful retest), re-takes $1,000, and prints a daily close above $1,036 — clearing the August 17 rejection point and the monthly R1 pivot together. The objective zone is $1,072-$1,110 (weekly R2 plus the mid-June congestion shelf); acceptance there opens the $1,149-$1,169 highs, with the $1,213-$1,255 blow-off zone as the major ceiling ahead of the fiscal Q4 report. A volume expansion through $1,036 would materially strengthen this path, because the advance so far has come on fading volume.
Neutral / no-trigger scenario
Neither trigger fires. The stock chops between the $886 confluence and the $1,036 rejection level on declining volume into the ~September 22 report — a plausible path given how much of the cycle debate (2027 supply allocation, memory pricing durability) only gets adjudicated by the next set of numbers. In this path the report itself becomes the resolution event, with the technical structure carrying event risk in both directions.
Sizing inputs
Not a recommendation — analytical inputs only. The natural risk-defining levels are the three invalidation floors: $950 (tight), $886 (intermediate), $827 (structural). The 14-day average true range is approximately $72, or 7.1% of price — this tape routinely moves 7-10% in a session (28 closes of ±8% or more in fifteen months), so any position sized off a $950 reference from a ~$962 tape is one ordinary session from its level; sizing should assume the full band $950-$886 can trade in a day or two of sector-wide pressure. Event risk concentrates at the estimated September 22 report, where a ±15-20% single-session move would be unremarkable by this stock's own recent history.
Prediction Log
Specific, checkable calls this report makes, logged so they can be scored against what actually happens.
| Prediction | Trigger / condition | Horizon | Logged |
|---|---|---|---|
| The $950-$961 support band holds on a closing basis through 2026-08-28 | Any daily close below $950.00 scores this a miss | 2026-08-28 | 2026-08-18 |
| If a daily close above $1,036.13 occurs before the fiscal Q4 report, price prints $1,072 or higher within ten trading sessions of that close | Conditional — activates on the qualifying close | Ten sessions from activation | 2026-08-18 |
| If a daily close below $886.00 occurs, price prints $854.40 or lower within five trading sessions | Conditional — activates on the qualifying close | Five sessions from activation | 2026-08-18 |
| Fiscal Q4 2026 revenue prints at or above the $49.0B guidance floor | The fiscal Q4 press release | The fiscal Q4 report (≈2026-09-22, unconfirmed) | 2026-08-18 |
| No shelf registration, at-the-market program, or convertible offering is filed before the fiscal Q4 report | Any S-3, 424B, or convertible-offering 8-K scores this a miss | The fiscal Q4 report date | 2026-08-18 |
| The CEO's pre-scheduled monthly sale cadence continues: a plan-flagged Form 4 sale with a transaction date in the 2026-08-20 to 2026-08-31 window is filed | EDGAR Form 4 filings | 2026-09-04 | 2026-08-18 |
Caveats and Data Provenance
Timing. Analysis runs through the August 17, 2026 close, with a premarket indication (approximately $962, −4.9%) taken at 8:23 a.m. Central on August 18 from a delayed feed; premarket prints are thin and indicative only, and the regular session that follows this report's preparation will move every short-term level relationship described here.
Data provenance. Price history and derived levels: exchange-sourced daily data (delayed feed); all moving averages, pivots, anchored VWAPs, RSI, and ATR figures are derived estimates computed by the stated conventions. Filings: SEC EDGAR primary documents (10-Q, 10-K, 8-K, Forms 4), cited by accession number where load-bearing. Analyst data: public aggregators only — and they materially disagree on this name (average target $1,259.97 versus $1,501.98, different counts, sampled days apart); no covering firm's research was accessed directly. News attribution: the drivers assigned to specific sessions (the July correction, the August recovery, this morning's weakness) are drawn from financial and trade press and are inference where the press itself is inferring — most notably, the "2027 capacity fully allocated" reporting that underpins the recovery narrative is trade-press sourced and is marked Unverified in this report.
What this report does not cover. The $100 billion / 16-agreement characterization of the Strategic Customer Agreements comes from press accounts of the earnings call and is not confirmed in the filings reviewed (the filings do confirm the take-or-pay structure and ≈$5B of customer deposits). The complete option-grant overhang behind insider holdings, the terms of the January 2026 charter amendment, the current-quarter debt balance after the March tender offers, and the merits or likely outcome of the Netlist patent actions were not examined at this depth. The estimated September 22 earnings date is not company-announced. Anything time-sensitive here may have changed by the time this is read — verify decision-critical figures against the primary sources cited.
Every figure in this report is tagged by verification status: Verified figures are read directly from primary sources — SEC filings cited by accession number — Estimates are derived by stated conventions, and anything that could not be confirmed is marked Unverified rather than presented as fact. The report's directional calls are logged with explicit triggers, horizons, and invalidation levels so they can be scored against what actually happens. Where the record is silent, the report says so instead of filling the gap.
Glossary
Every technical term in this report is defined in the site glossary: Plain-English Glossary →
Disclaimer
This report is for informational and educational purposes only and is not investment advice, a recommendation, or an offer or solicitation to buy or sell any security. The directional scenarios and sizing inputs describe possibilities and analytical inputs, not personalized recommendations. Technical patterns and price targets are conventions, not predictions, and can fail. Verify all data against primary sources before acting. Trading involves substantial risk of loss. The author is not a registered investment adviser or broker-dealer.